Burndown chart
Burndown chart provides remaining effort for a given period of time. This is one of the simplest metrics team normally adopt to measure the progress of sprint or release.
It also represent the velocity at which you are completing your customer stories.
During a typical development life cycle, following two flavors of burn down chart can be used:
1. Sprint Burndown and
2. Release Burndown
Scope of the article is to describe Sprint Burn down and narrate a story to your stakeholders
Expected Burndown chart
Assumptions
a. Lets assume that team will complete a project with all user/customer stories in Nine iterations.
b. Scrum team burns 10 pts of story size in an iteration. This is a velocity of scrum team
It shows amount of work remaining and work done during each iteration.
Legends:
Y-Axis: Work Remaining
X- Axis: Effort (in story points)
Such a simple brundown chart can tell you following story about the progress:
1. Current iteration = 6th
2. Remaining iterations = 3
3. You and your team have completed 40 story points of effort
4. Looking at the burn down chart you can narrate following story:
"Team has maintained a velocity of 10 story points and will complete the user/customer stories right on time. No major defects re introduced in the product and team is able to take care of them efficiently"
 In reality - How a burn down chart look
Team never sees an ideal burn down chart. The velocity of the team changes every iteration and there is no straight line trend.
Each sprint demonstration or QA process results in a change to the development. This change could because of many reasons, for now let me consider the below two probable cause:
a. Defects identified and reported
b. Feedback from end of sprint demo
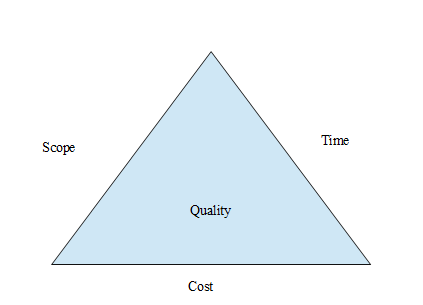
Thus effecting : a. Scope, b. Time, c. Cost and Quality of deliverable.
Below image shows a typical Burndown of a project?

Above chart is a result of one or more causes listed below (not limited to below list):
Burndown chart provides remaining effort for a given period of time. This is one of the simplest metrics team normally adopt to measure the progress of sprint or release.
It also represent the velocity at which you are completing your customer stories.
During a typical development life cycle, following two flavors of burn down chart can be used:
1. Sprint Burndown and
2. Release Burndown
Scope of the article is to describe Sprint Burn down and narrate a story to your stakeholders
Expected Burndown chart
Assumptions
a. Lets assume that team will complete a project with all user/customer stories in Nine iterations.
b. Scrum team burns 10 pts of story size in an iteration. This is a velocity of scrum team
It shows amount of work remaining and work done during each iteration.
 |
| Ideal Burn down chart |
Y-Axis: Work Remaining
X- Axis: Effort (in story points)
Such a simple brundown chart can tell you following story about the progress:
1. Current iteration = 6th
2. Remaining iterations = 3
3. You and your team have completed 40 story points of effort
4. Looking at the burn down chart you can narrate following story:
"Team has maintained a velocity of 10 story points and will complete the user/customer stories right on time. No major defects re introduced in the product and team is able to take care of them efficiently"
 In reality - How a burn down chart look
Team never sees an ideal burn down chart. The velocity of the team changes every iteration and there is no straight line trend.
Each sprint demonstration or QA process results in a change to the development. This change could because of many reasons, for now let me consider the below two probable cause:
a. Defects identified and reported
b. Feedback from end of sprint demo
Thus effecting : a. Scope, b. Time, c. Cost and Quality of deliverable.
Below image shows a typical Burndown of a project?

1. Scope discovery
2. Team member leaves the project
3. Natural disaster
4. Scope creep (function creep, feature creep, requirement creep,..)
5. Requirement change
6. Reported bugs/defect in the system
I have a story for my stakeholders by just looking at above burn down chart.
- See more at about Burndown chart @ scrumalliance.org
No comments:
Post a Comment